Global Dashboard
The Invicti Enterprise Global dashboard offers a concise summary of the security status for all target groups within your Invicti Enterprise account. This document explains the information available to view on the global dashboard.
How to view the Global Dashboard
The Global dashboard is the default page displayed when you log in to Invicti Enterprise. You can also access the global dashboard by selecting Targets > Dashboard from the menu.
Default view
The default view shows information about all your targets for the last 3 months. The information is grouped and displayed on interactive widgets. Each of those widgets is explained in the later sections of this document.
Customized view
Using the Target Group drop-down, you can filter the displayed information by:
- One of your target groups: This will show aggregated information for all the targets you have assigned to the selected target group.
- Default: This will show aggregated information for all targets assigned to the default target group. (All new targets you add to your Invicti Enterprise account are automatically added to the Default group unless you remove them.)
- All Targets: This will show aggregated information for all the targets you have added to your Invicti Enterprise account (regardless of which target group they are assigned to).
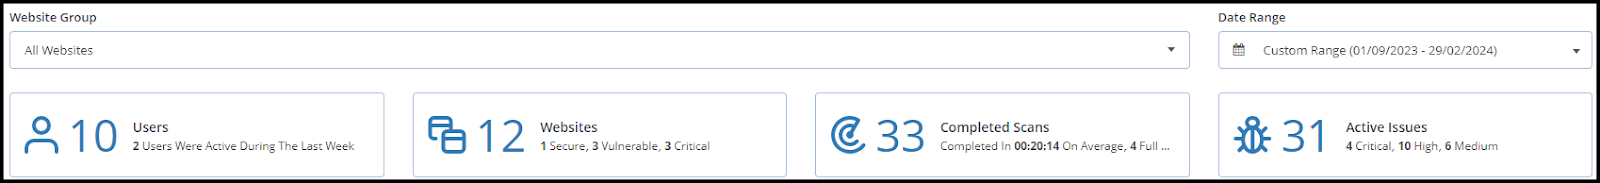
The second option for a customized view is to select a different Date Range or enter a custom period. Use the Date Range drop-down to select from the following options:
- Last 1 Month
- Last 3 Months
- Last 6 Months
- Custom Period (cannot be longer than 6 months)
The information displayed on the global dashboard updates as soon as you select a customized view.
Global dashboard widgets
The global dashboard contains many widgets that display graphs and tables pertaining to your scan results. Refer to the individual sections below to learn about the information displayed on each widget.
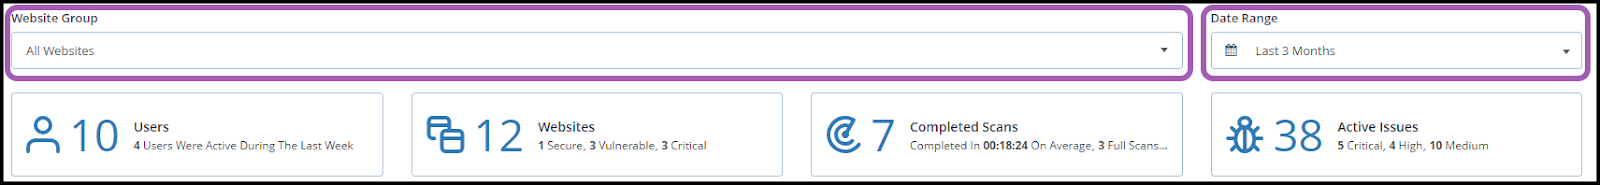
Top panel
The top panel of the dashboard contains the following widgets:
- Users: Displays both the current number of users and the count of active users on your account over the past week.
- Targets: Presents the total count of targets in the selected target group. It also offers a breakdown of these targets, categorizing them as secure, vulnerable, or critical.
- Completed Scans: Illustrates the number of scans completed within the selected date range and the average duration for completion. Additionally, it provides the total count of successfully completed scans.
- Active Issues: Presents the count of unresolved issues detected within the selected date range. It also highlights the number of unresolved Critical, High, and Medium issues.
Each widget is clickable and takes you to the relevant section of the Invicti Enterprise UI.
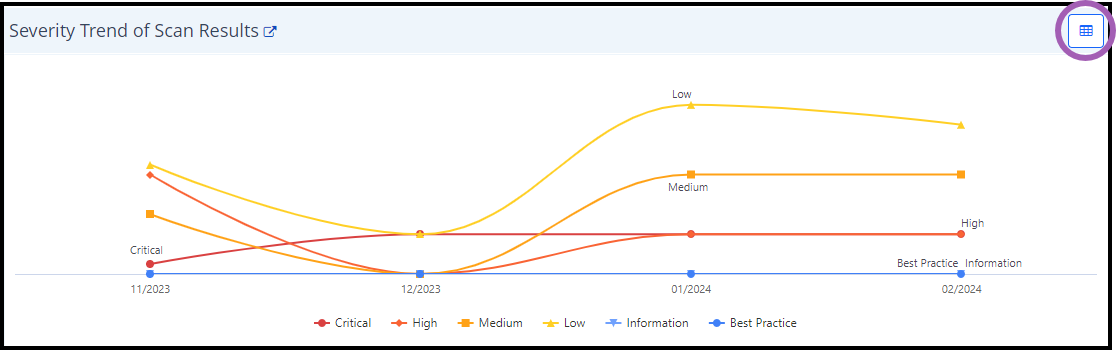
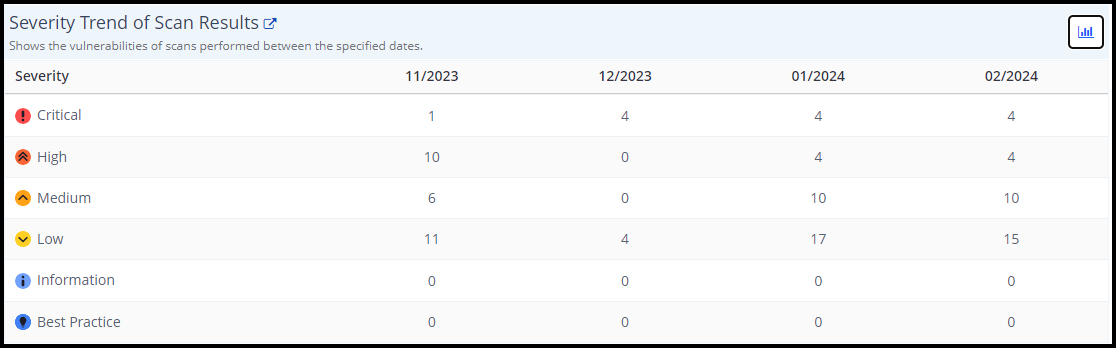
Severity Trend of Scan Results
This widget visualizes issues grouped by severity, allowing you to explore the count of each severity on specific dates by hovering over the lines. Click the icon in the top-right corner to toggle between a table view and a chart view.
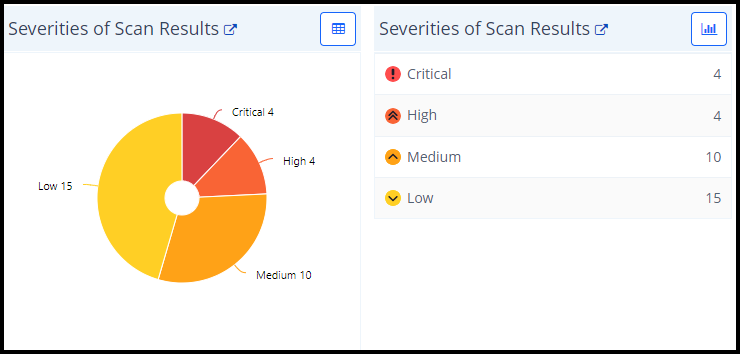
Severities of Scan Results
The Severities of Scan Results widget presents a pie chart depicting each severity category along with its respective count. The data in this pie chart reflects the conclusion of the specified date range, meaning that the values presented here align with those found in the last column of the Severity Trend of Scan Results widget. Click the icon in the top-right corner to toggle between a table view and a chart view.
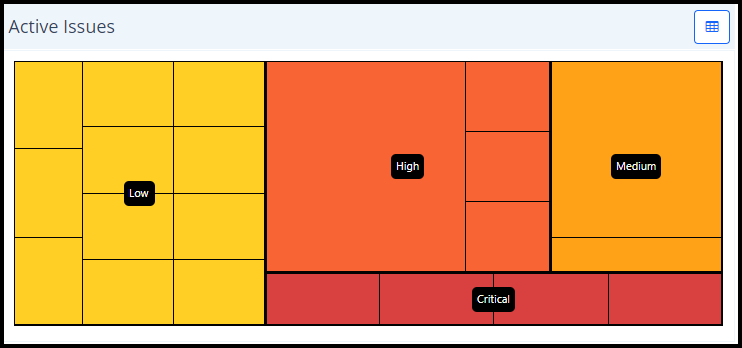
Active Issues
The treemap representation of active issues offers an overarching view of the current issues, with the option to drill down for further exploration. The total count of all active issues in this widget matches the total number of active issues in the top panel. Click the icon in the top-right corner to switch between a chart view and a table view. To dive deeper into the information, each active issue is clickable, taking you to a filtered view of the Issues page where you can view more detailed information about the selected issue.
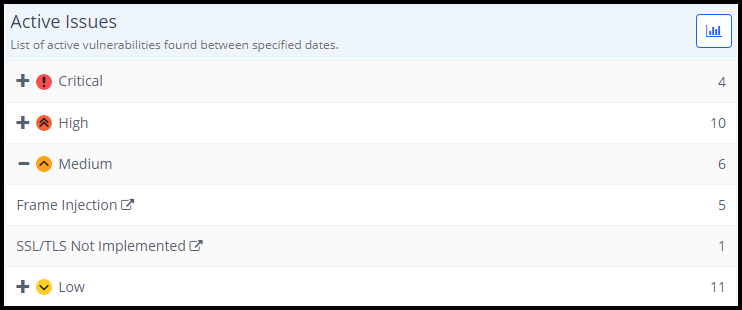
The screenshot below shows the table view with expanded Medium vulnerabilities.
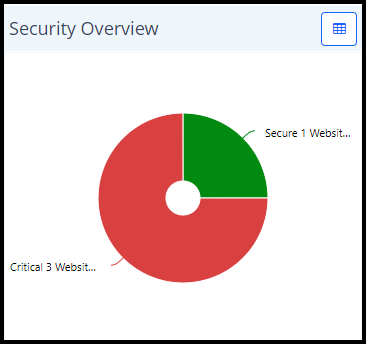
Security Overview
The Security Overview widget features a pie chart illustrating the threat levels of the targets, categorized as follows:
- Secure: No Medium, High, or Critical issues detected in the scan.
- Needs Attention: Some issues require addressing to enhance security.
- Insecure: The targets are insecure and vulnerable to malicious attacks.
- Critical: The targets have critical vulnerabilities that can lead to data compromisation.
The numbers in this widget correspond to those in the Targets count in the top panel. Click the icon in the top-right corner to switch between a chart view and a table view.
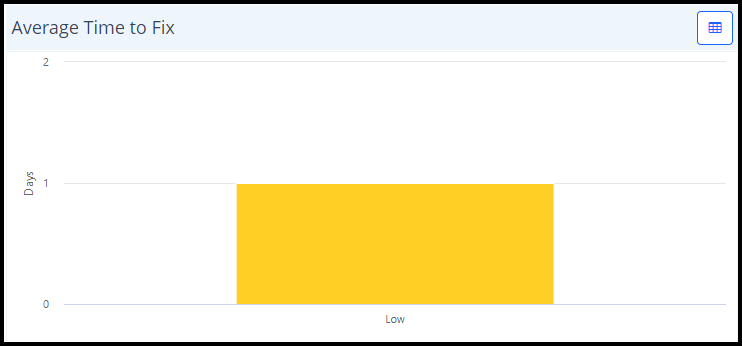
Average Time to Fix
This is a column chart that displays the average length of time it takes to fix issues. The information is grouped by vulnerability severity level. This widget is visible to all global dashboard users but hidden if there are no fixed issues in the selected target group.
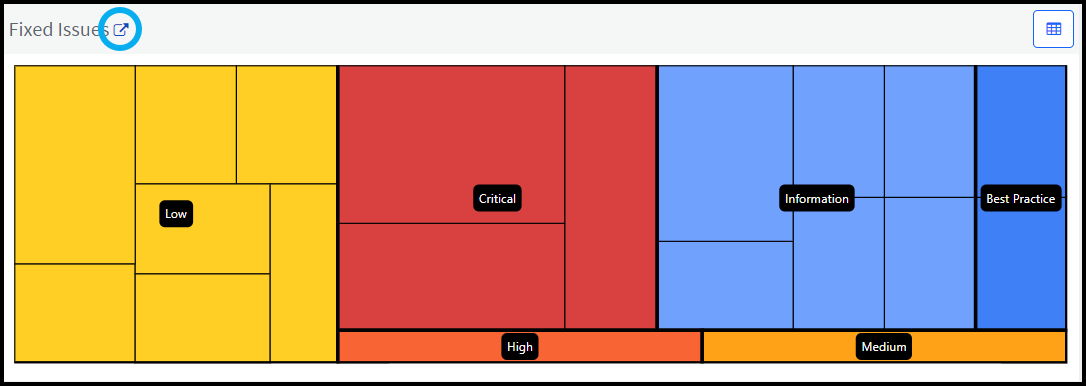
Fixed Issues
This is a column chart that displays the number of issues that have been fixed in each vulnerability severity level within the specified date range. The link icon on the left takes you to the Issues > All Issues page, where a filter is automatically applied based on your global dashboard configuration (target group selection, date range specification, and issue present = no).
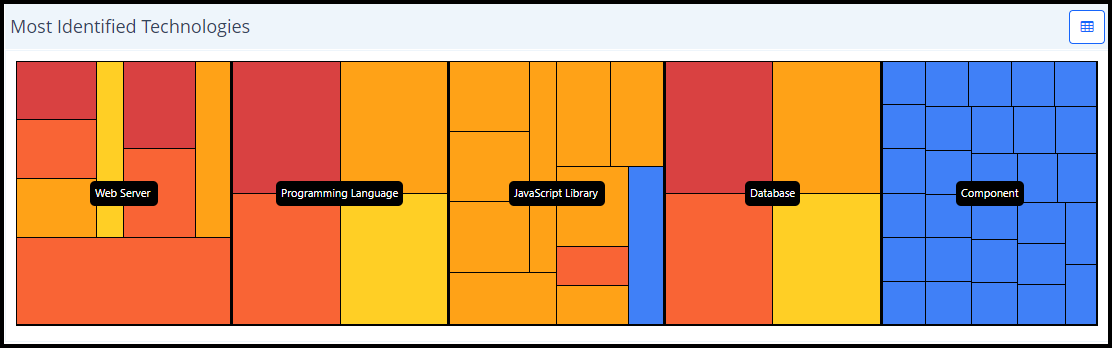
Most Identified Technologies
This widget offers insights into the versions of the most commonly identified technologies. Clicking on the panels in the widget takes you to the Technologies Dashboard (give link).
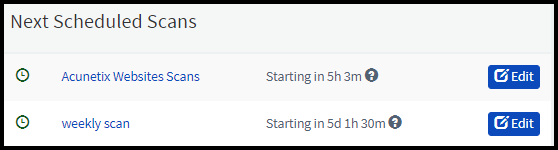
Next Scheduled Scans
The Next Scheduled Scans widget displays a list of upcoming scans ordered by schedule. To edit a scan, click the Edit button.
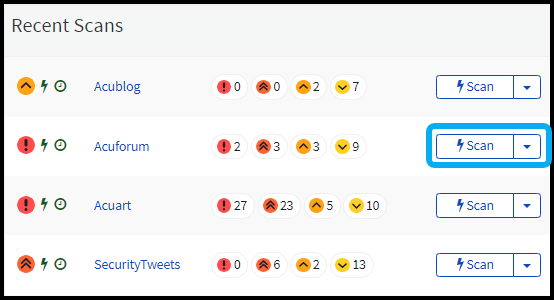
Recent Scans
This widget displays a list of all recent scans that are either In Progress or Completed. For each listed scan there is a count displayed for the vulnerability severity levels. The following actions are possible from the recent scans widget:
- Click on a scan in the list to go directly to its Scan Summary report.
- Click Scan to run a new scan of the target with the same set of configurations as the recent scan.
- Create an incremental scan with the parameters of the recent scan. Click the down arrow and select Incremental Scan.
- Perform a retest of the vulnerabilities detected in a recent scan. Click the down arrow and select Retest.
- Create a scheduled scan with the parameters of the recent scan. Click the down arrow and select Scheduled Scan.
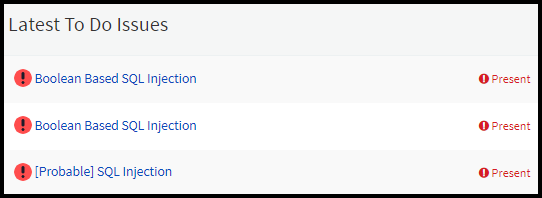
Latest To Do Issues
This widget displays the latest detected issues with an icon indicating their vulnerability severity level. It is linked to the Issues > To Do page. This widget orders ‘Active’ (Not Addressed) vulnerabilities by severity in descending order.
Other dashboards
For information about other dashboards available in Invicti Enterprise, refer to the following documentation: