Invicti Enterprise dashboards
Invicti Enterprise contains three dashboards that enable you to view scan results, vulnerabilities, issues, statistics, and other information from a single window, both while scans are running and once they are completed. This document provides a brief overview of each dashboard.
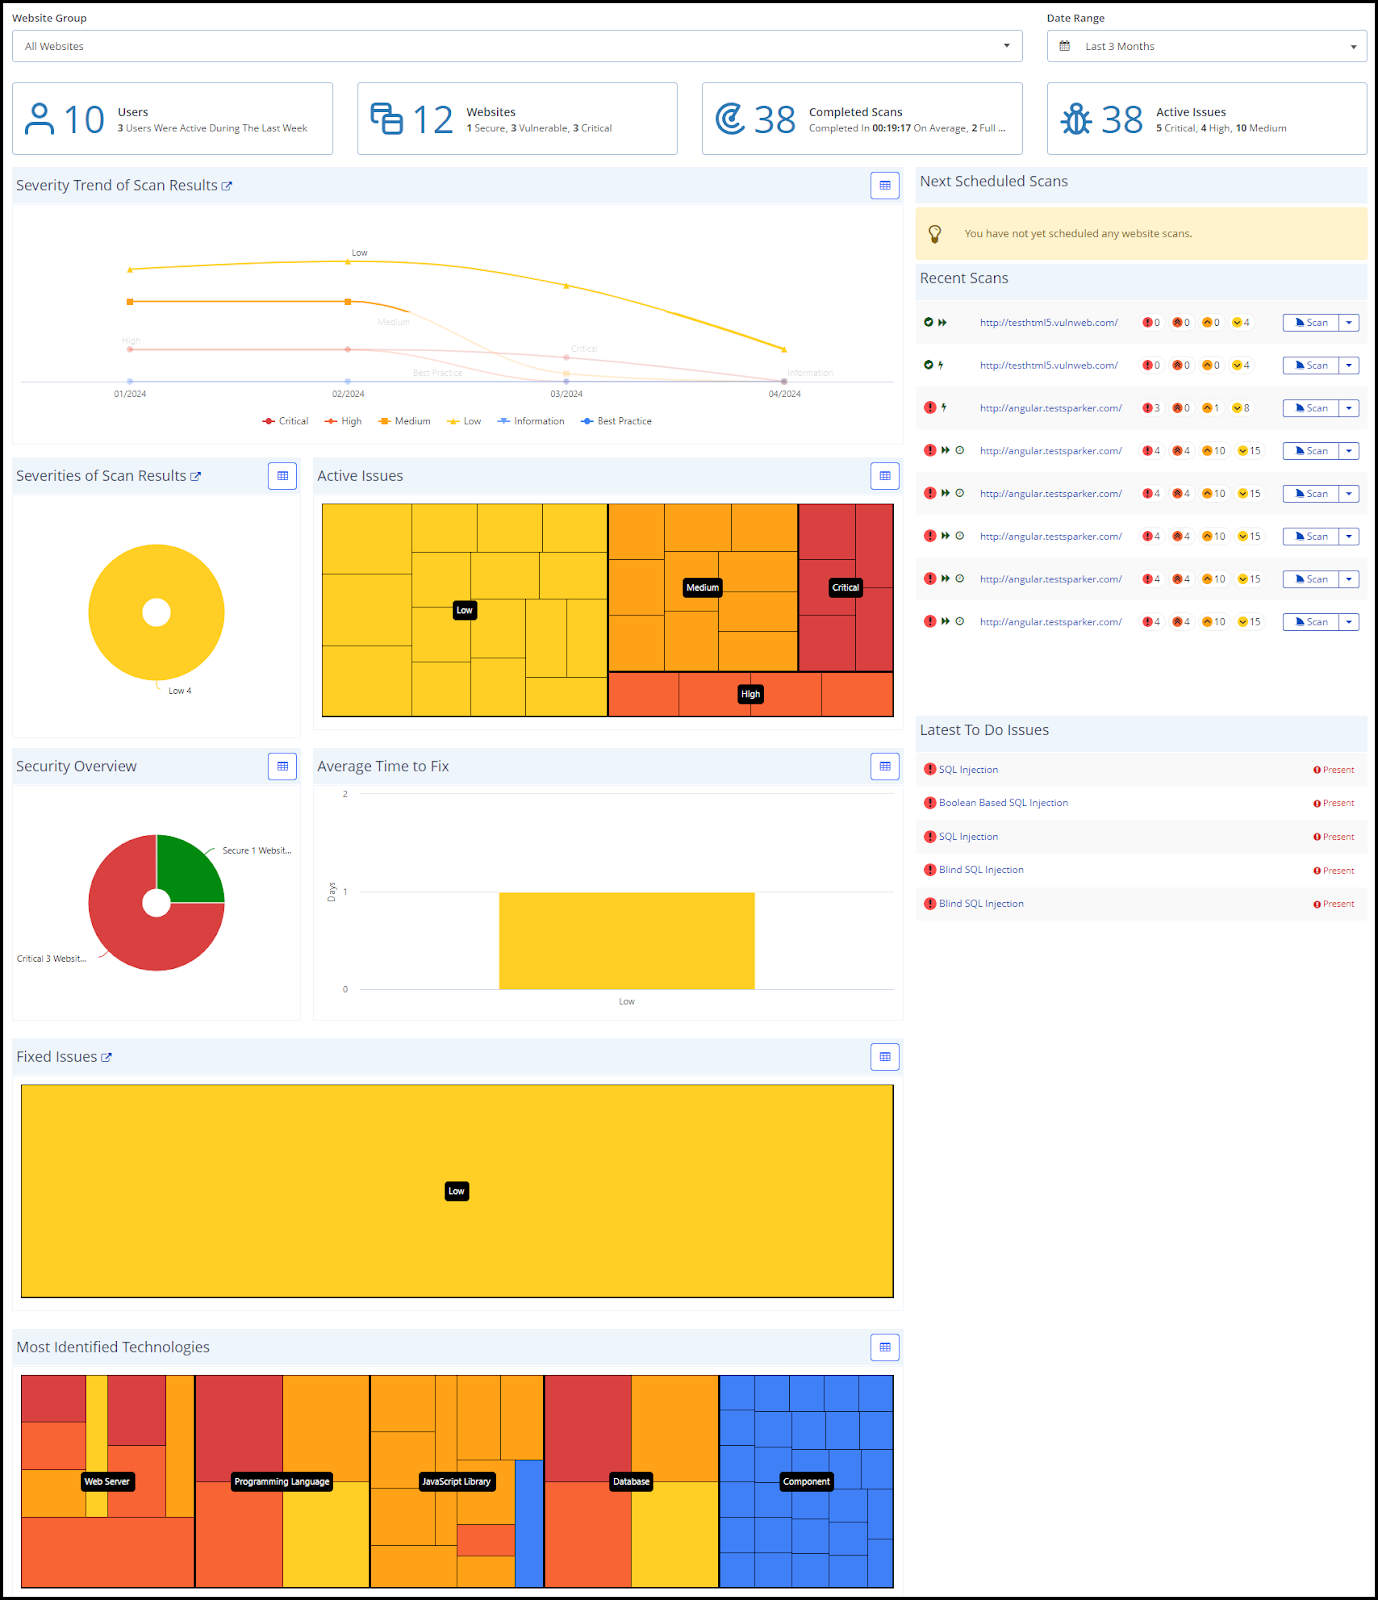
Global Dashboard
The Global Dashboard provides a high-level summary of the security status for all Target Groups in your Invicti Enterprise account. It is the default page displayed when you log in to Invicti Enterprise. Explanations of each dashboard widget can be found in the dedicated Global dashboard documentation.
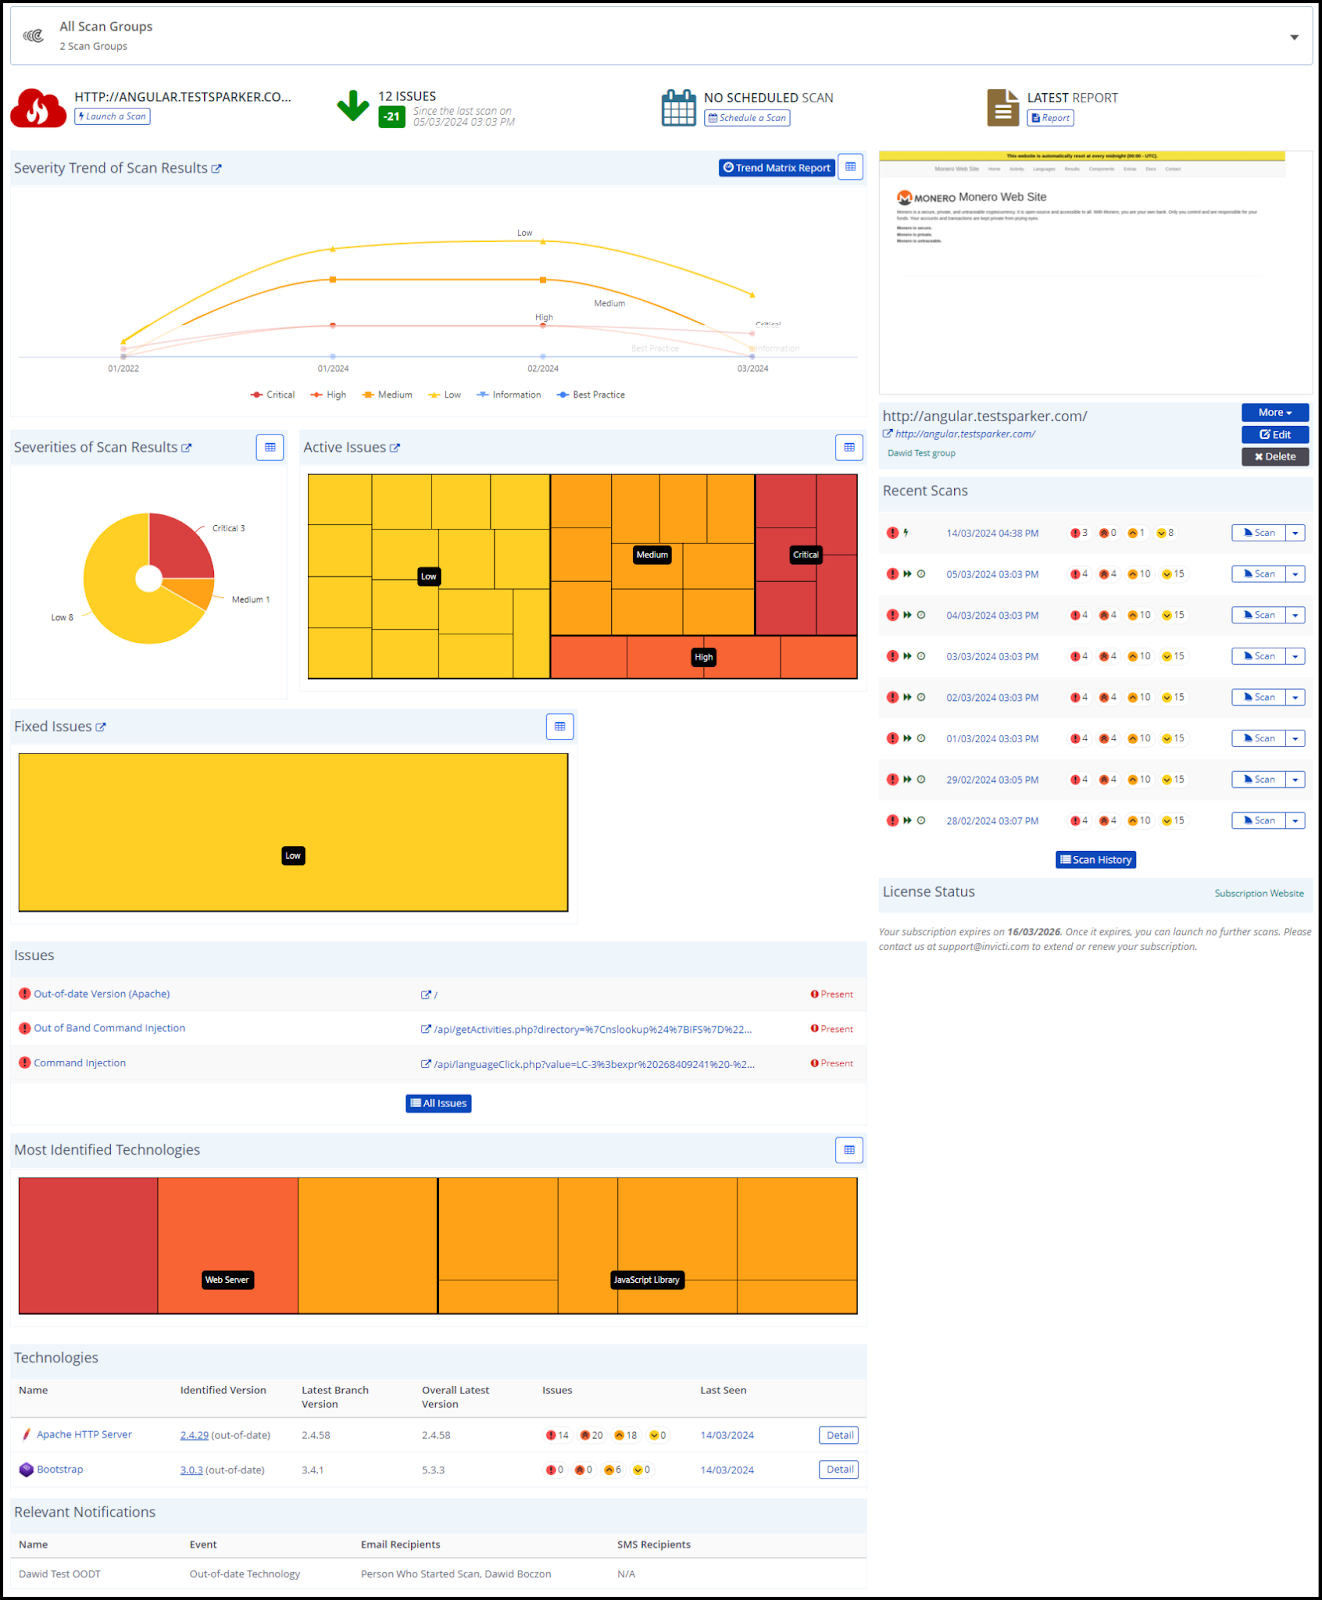
Targets Dashboard
The Targets Dashboard provides real-time access to the latest security scan outcomes for individual targets, both during and after completion of the scan process. Additionally, you have the option to review previous security scans conducted under various configurations, including those utilizing identical Scan Policies and Scan Settings. Explanations of each dashboard widget can be found in the dedicated Targets dashboard documentation.
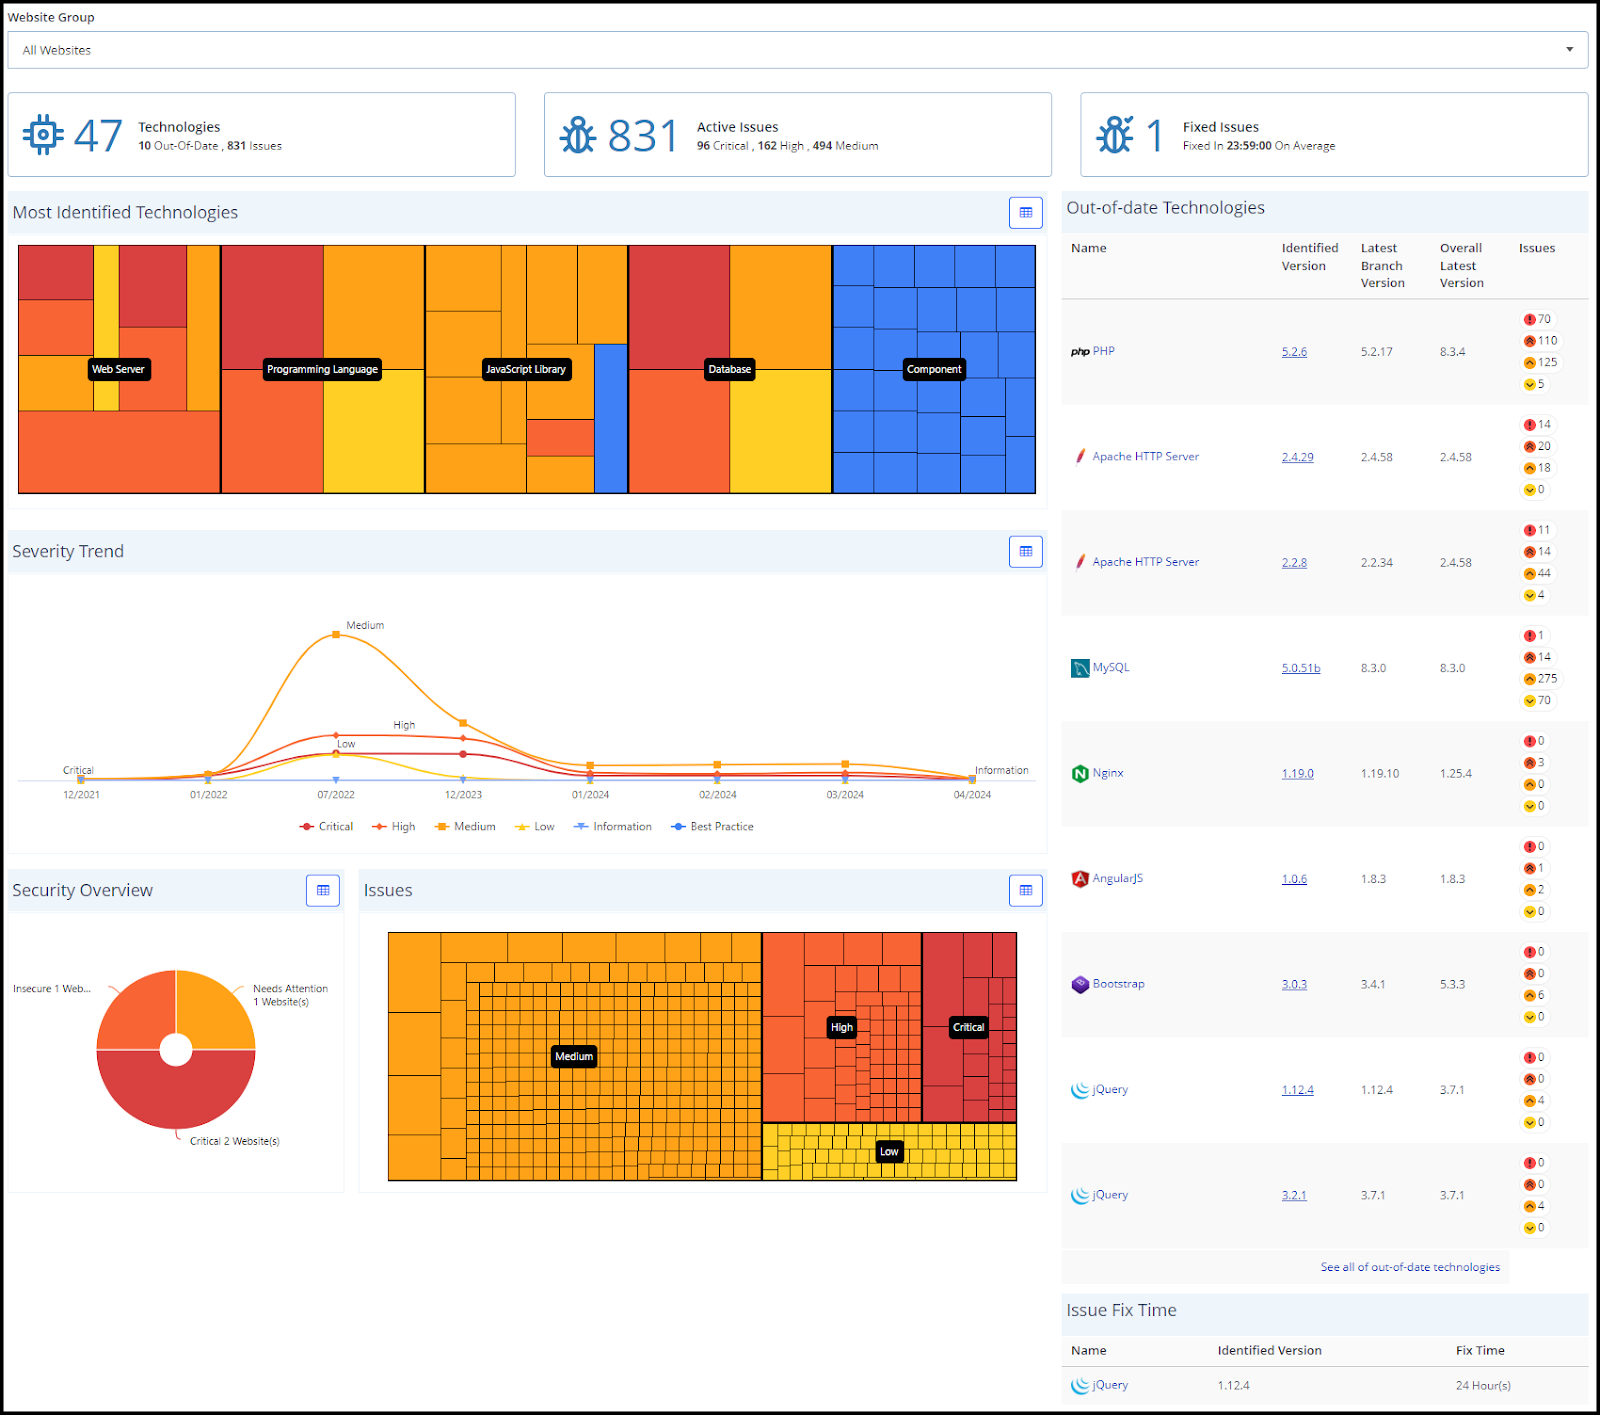
Technologies Dashboard
The Technologies Dashboard provides an overall, cumulative picture of the types and numbers of technologies detected in your scanned web applications. Technologies are all the software versions of servers, databases, client and server-side libraries, and frameworks detected as in use on your targets. The dedicated Technologies dashboard documentation provides in-depth explanations of each dashboard widget.