Chart Reports
In addition to Built-In Reports and Report Templates, Invicti Enterprise lets you generate various chart reports that create statistical images for a particular target group or vulnerability during a specific date range.
This article explains how to:
- Generate a chart report
- Create vulnerabilities list reports for target groups
- Save report filters for future use
NOTE: For information about generating a PCI Compliance report, refer to PCI DSS Scanning in Invicti and PCI DSS Compliance Report. |

Generating chart reports
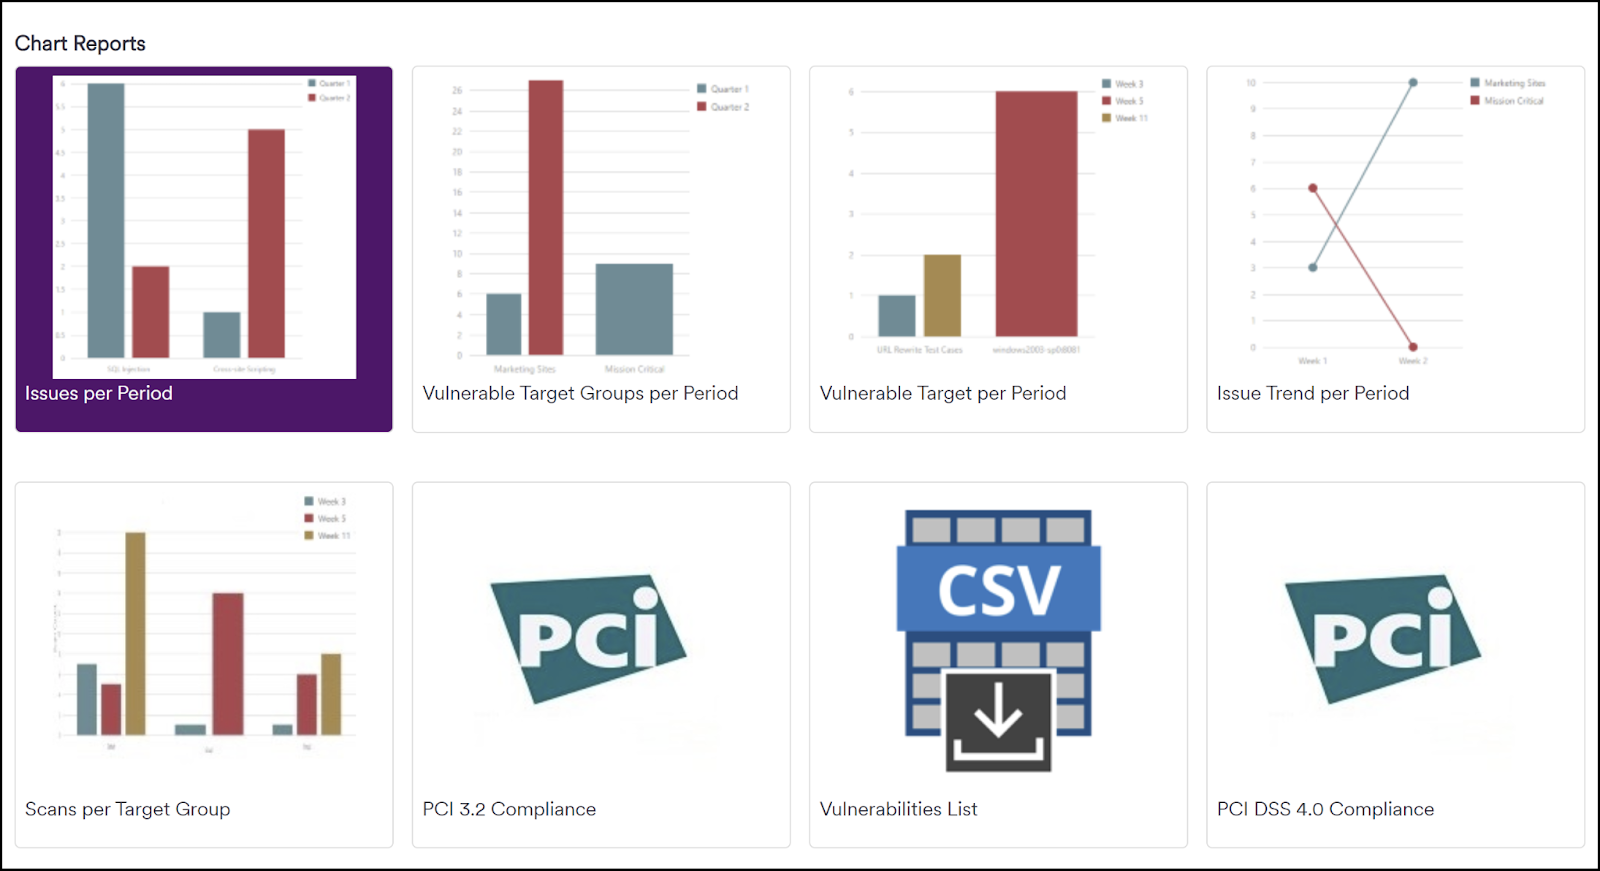
The following chart reports are available:
Report name | Description |
Issues per Period | Displays the number of issues (e.g., SQL Injection) detected on your account within a specified period. |
Vulnerable Target Groups per Period | Displays the number of issues detected on your account, grouped by target group, within the specified period. |
Vulnerable Targets per Period | Displays the number of issues detected on your account, grouped by target, within the specified period. |
Issue Trend per Period | Displays the number of issues detected on your account, grouped by week, within the specified period. |
Scans per Target Group | Displays the number of scans run on your account, grouped by target group, within the specified period. |
How to create a chart report
- Select Reporting > Reporting from the left-side menu.
- Select the chart report you want to generate.
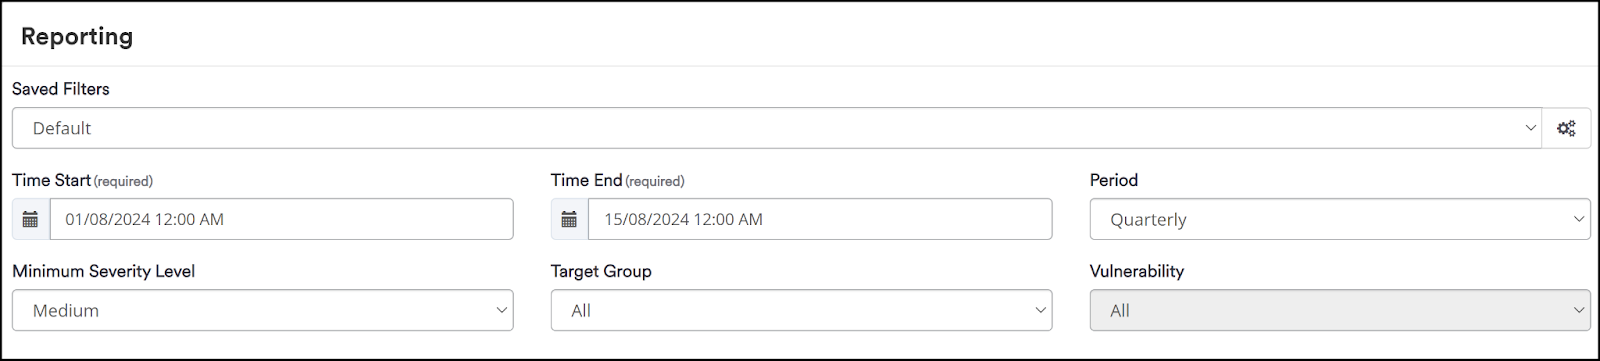
- Specify the Time Start and Time End for the report. This sets the reporting period.
- Use the drop-down to select the Period length (daily, weekly, monthly, quarterly, annually).
- Use the drop-down to select a Minimum Severity Level for the vulnerabilities to include in the report.
- Choose the Target Group whose scan results will be included in the report.
- Select a Vulnerability (Issue Trend per Period report only).
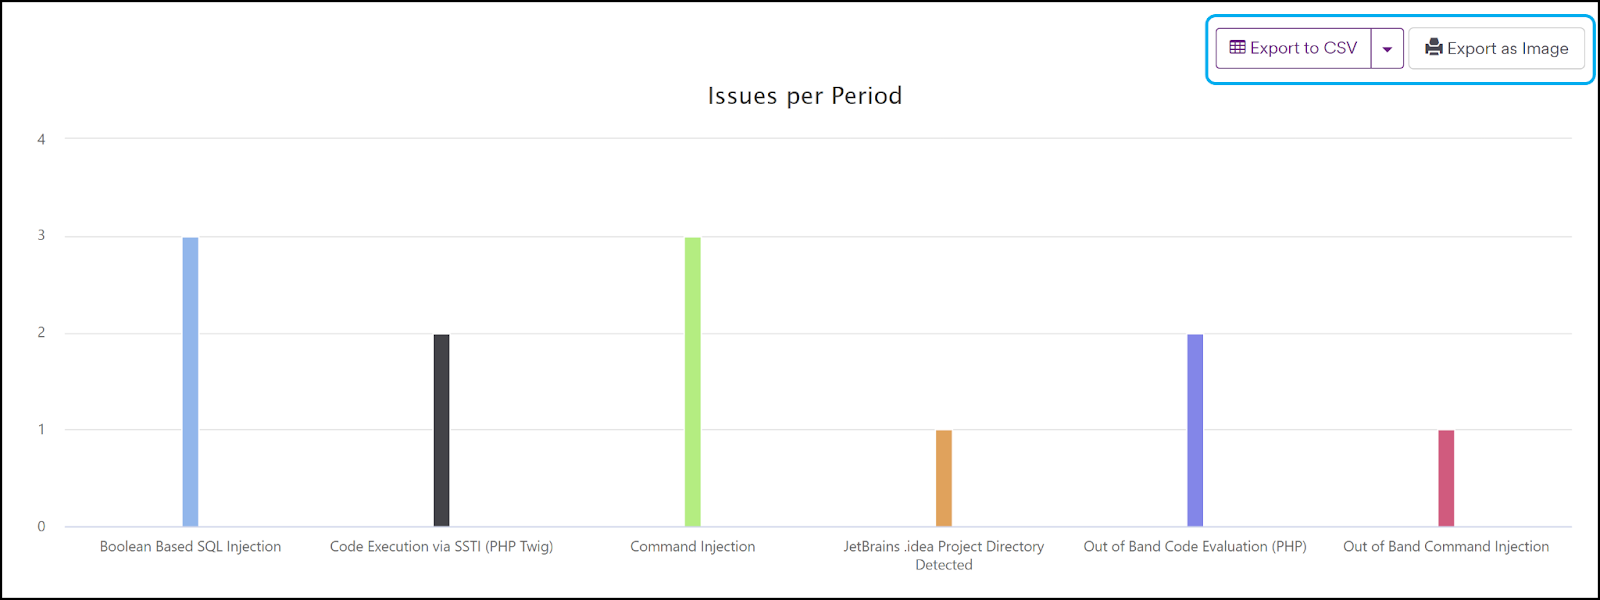
- Click Run at the bottom of the page to generate the report. The Reporting page will refresh and your report will appear at the bottom.
- Select Export to CSV or Export as Image to download the report.
The download starts immediately. You can open the file from your default download location.
Generating a vulnerabilities list report
This report displays the vulnerabilities of a group of targets. It is exportable as a CSV file.
How to generate a vulnerabilities list report
- Select Reporting > Reporting from the left-side menu.
- Select Vulnerabilities List.
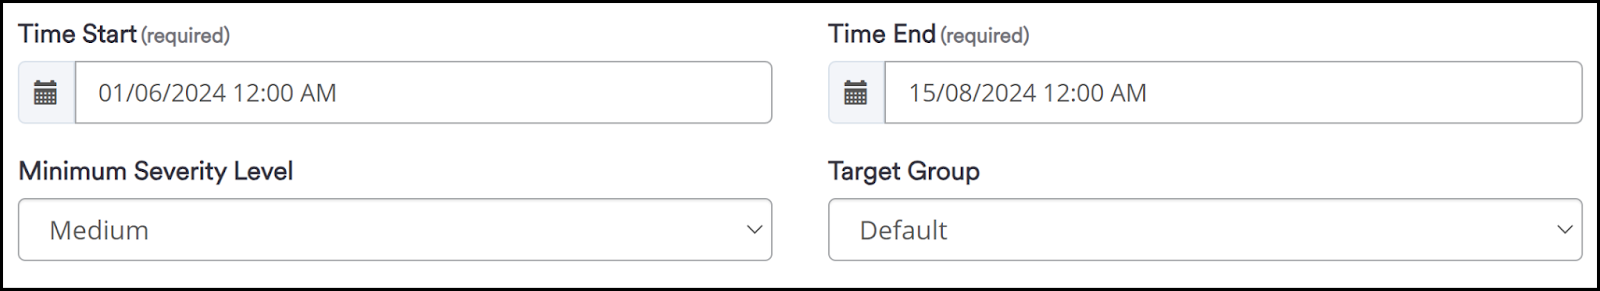
- Specify the Time Start and Time End for the report. This sets the reporting period.
- Select a Minimum Severity Level for the vulnerabilities to include in the report.
- Choose the Target Group whose scan results will be included in the report.
- Click Export at the bottom of the page to generate the report.
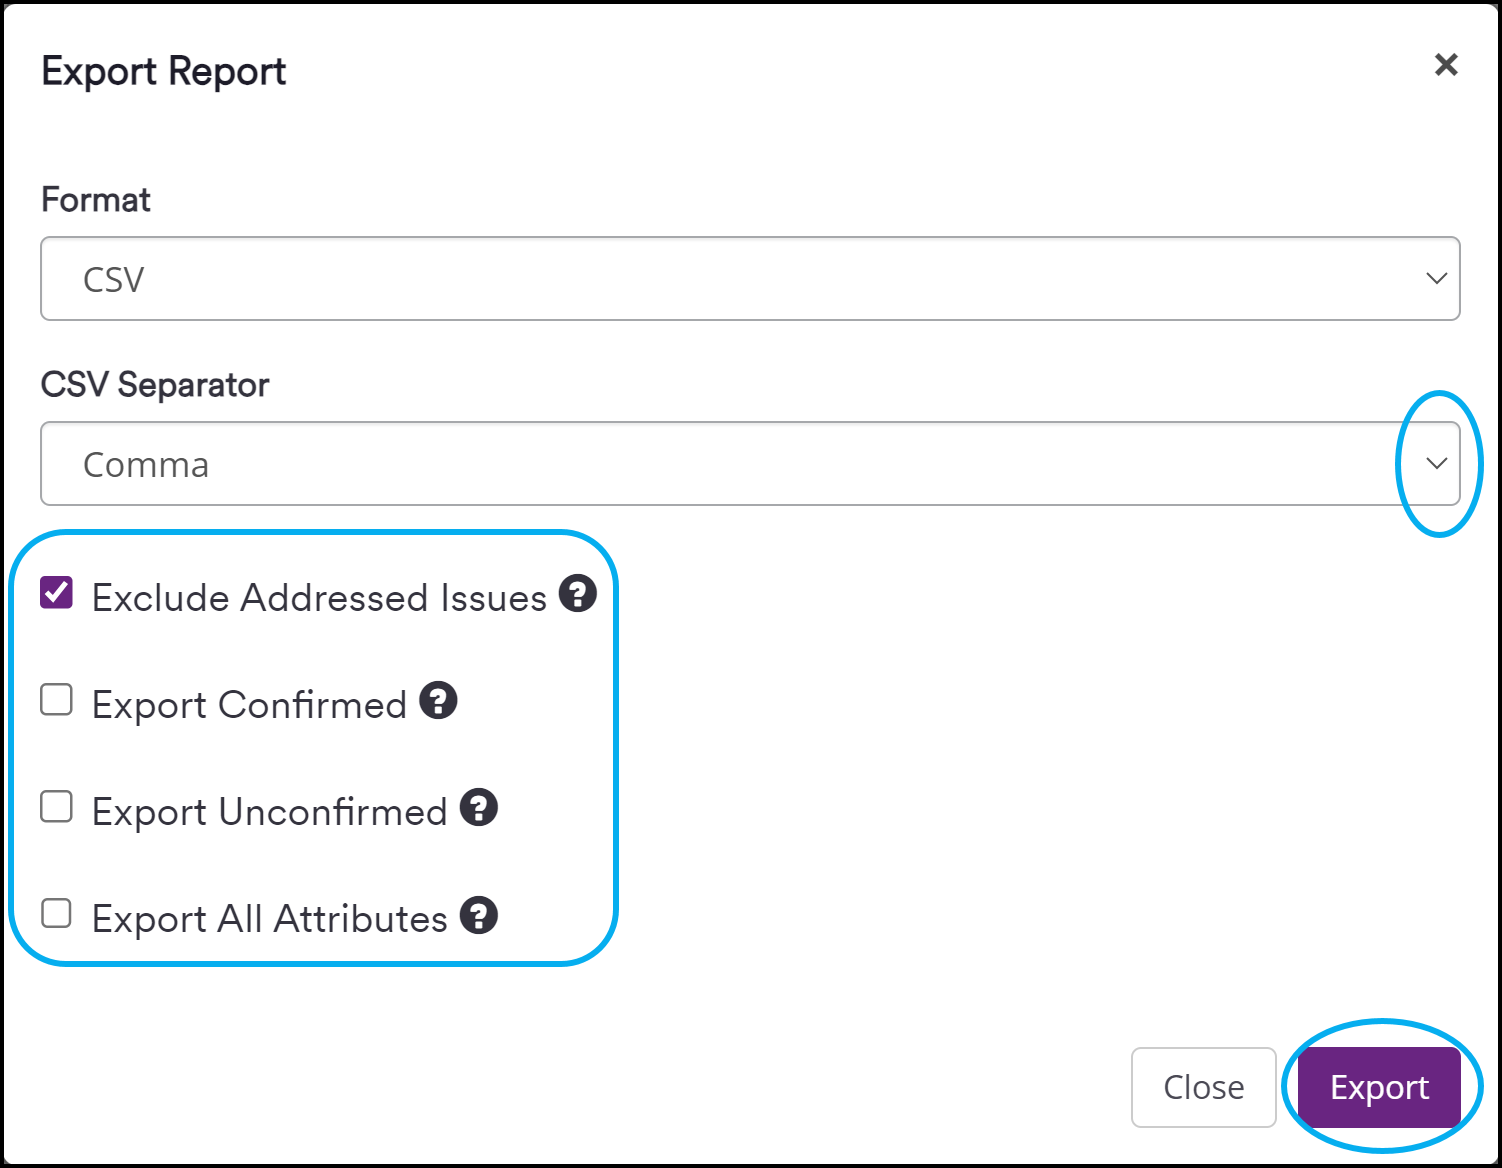
- In the Export Report dialog, configure your report as follows:
- Use the CSV Separator drop-down to choose an option.
- Select Exclude Addressed Issues if you want to exclude issues for which you've already taken action.
NOTE: All Information level findings are marked as Accepted Risk by default. To change this behavior, refer to Do not mark Information issues as accepted risks in General Settings. |
- Select Export Confirmed to include only confirmed issues.
- Select Export Unconfirmed to include only unconfirmed issues.
- Select Export All Attributes to include all attributes related to the vulnerabilities.
- Click Export.
The download starts immediately. You can open the file from your default download location.
Saving report filters
Saving report filters allows you to reuse your preferred filters later or easily modify them.
How to save report filters
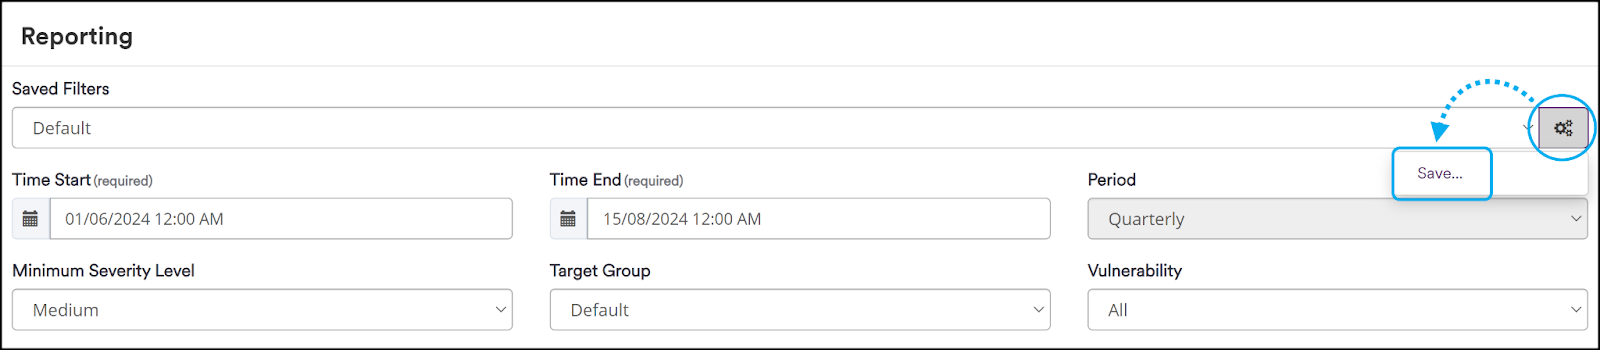
- After selecting your report filters, click the gears icon () at the end of the Saved Filters field, then select Save….

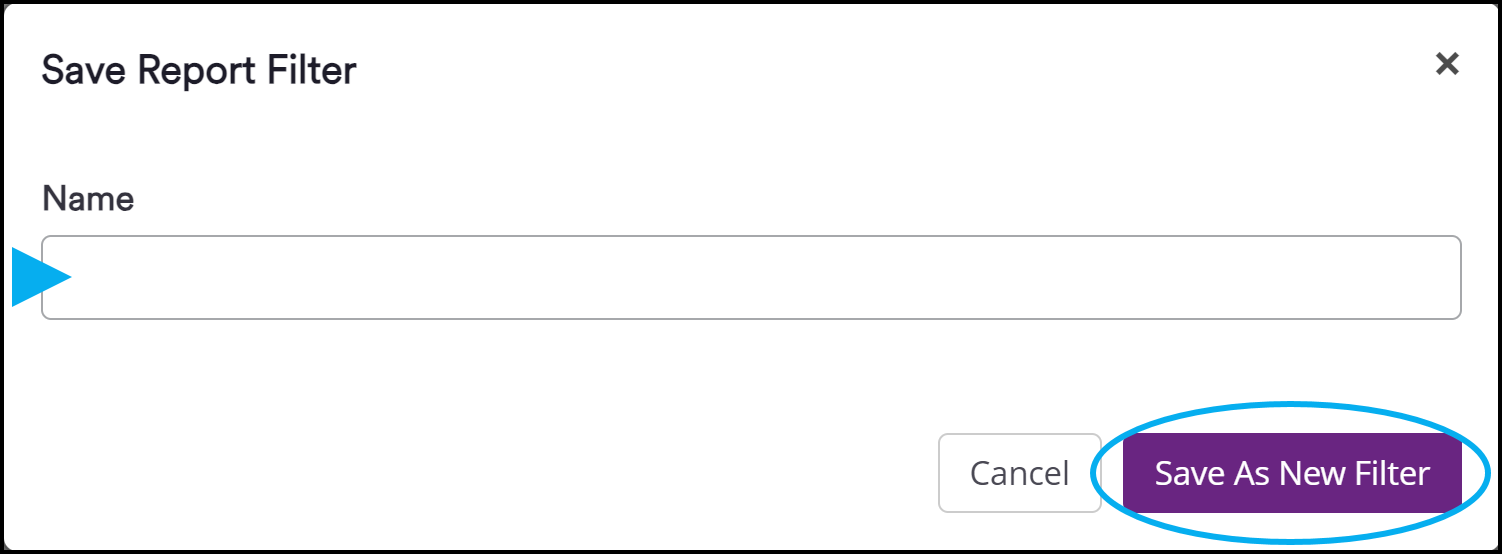
- On the Save Report Filter dialog, enter a name for your filter and select Save As New Filter.
Invicti Enterprise informs you that your filter has been saved. From the Saved Filters drop-down, you can now select your filter for faster configuration when generating reports.